LENDEMAINS: Literary Landscapes
Barbara Piatti, with visualisations by Anne-Kathrin Reuschel
Rendering visible literary landscapes. A Plea for Experiments between Cartography and Literary Studies (Original Title: Rendre visible les paysages littéraires: plaidoyer pour des expériences entre la cartographie et les études littéraires)
Provided below are the colour illustrations of a forthcoming article (in french), which is published in black and white in the french journal »Lendemains«.
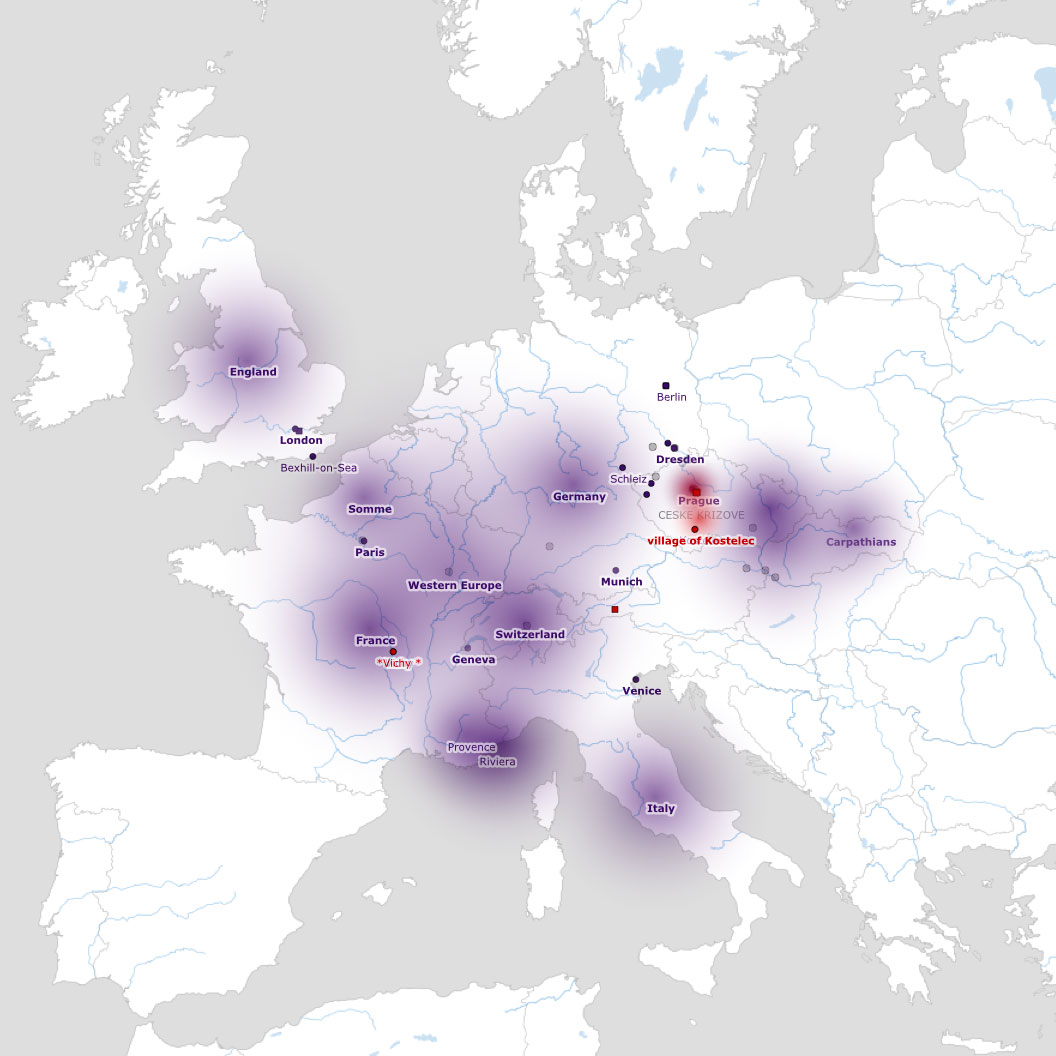
Figure 1: Bruce Chatwin, »Utz« (1988). The maps shows the dimension of projected spaces of this novel on European scale. In our definition, projected spaces are not actual settings, but places a character is longing for, remembers or dreams of.

Figure 2: Projected spaces on the world map, connected to model region Prague (which means that a significant part of the plots is set in Prague). Body of texts: 77 fictional texts (novels, novellas, short stories etc.), published in their majority between 1861 and 1918
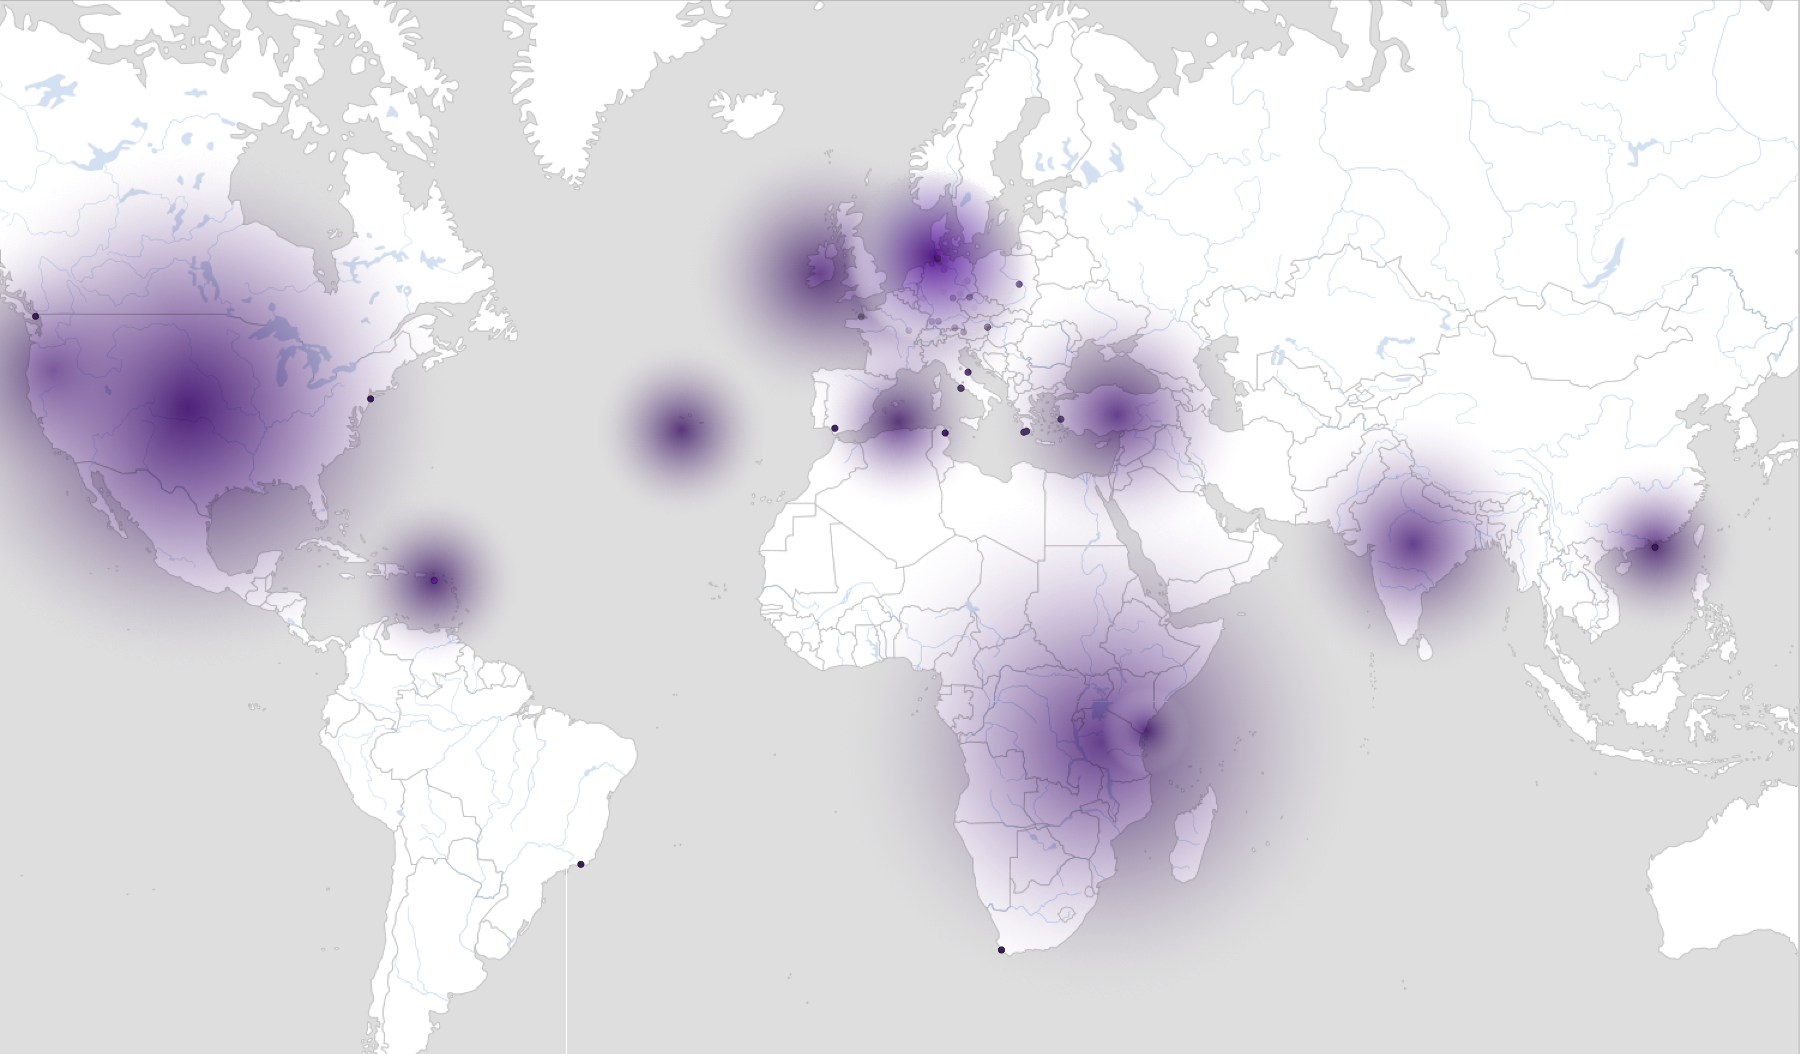
Figure 3: Projected spaces on the world map, connected to model region Northern Frisia (which means that a significant part of the plots is set in that coastal area). Body of texts: 113 fictional texts (novels, novellas, short stories etc.), published in their majority between 1847 and 1938 (among them 35 works written by the most famous writer of this region, Theodor Storm).
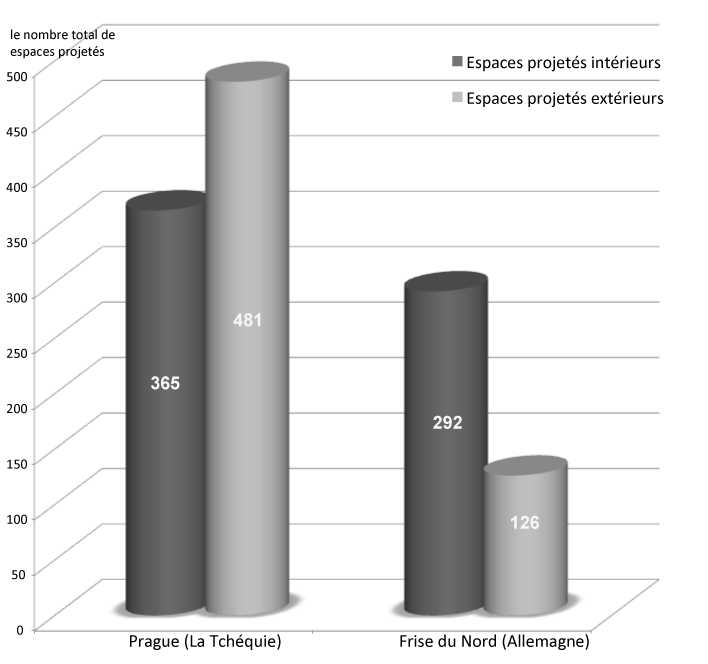
Figure 4: Distribution chart of the projected spaces connected to model regions Prague and Northern Frisia (black = situated inside model region; grey = situated outside model region). Visualisation: Anne-Kathrin Reuschel, ETH Zurich
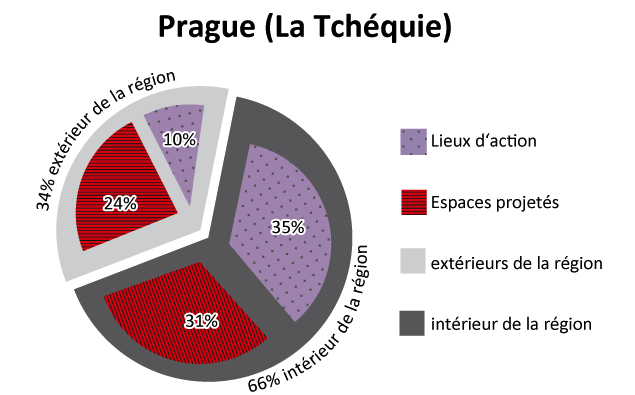
Figure 5a: Pie chart of settings and projected spaces within model region Prague. Visualisation: Anne-Kathrin Reuschel, ETH Zurich
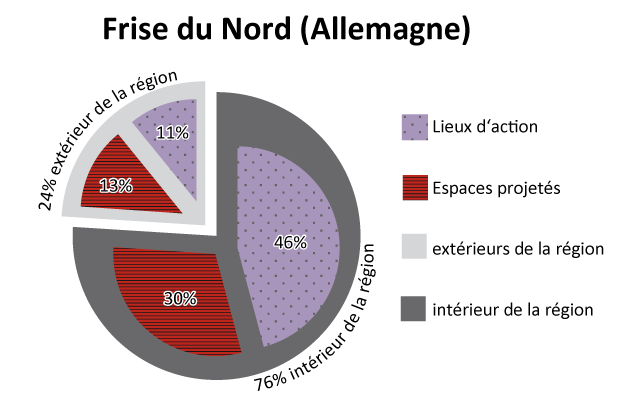
Figure 5b: Pie chart of settings and projected spaces within model region Northern Frisia. Visualisation: Anne-Kathrin Reuschel, ETH Zurich
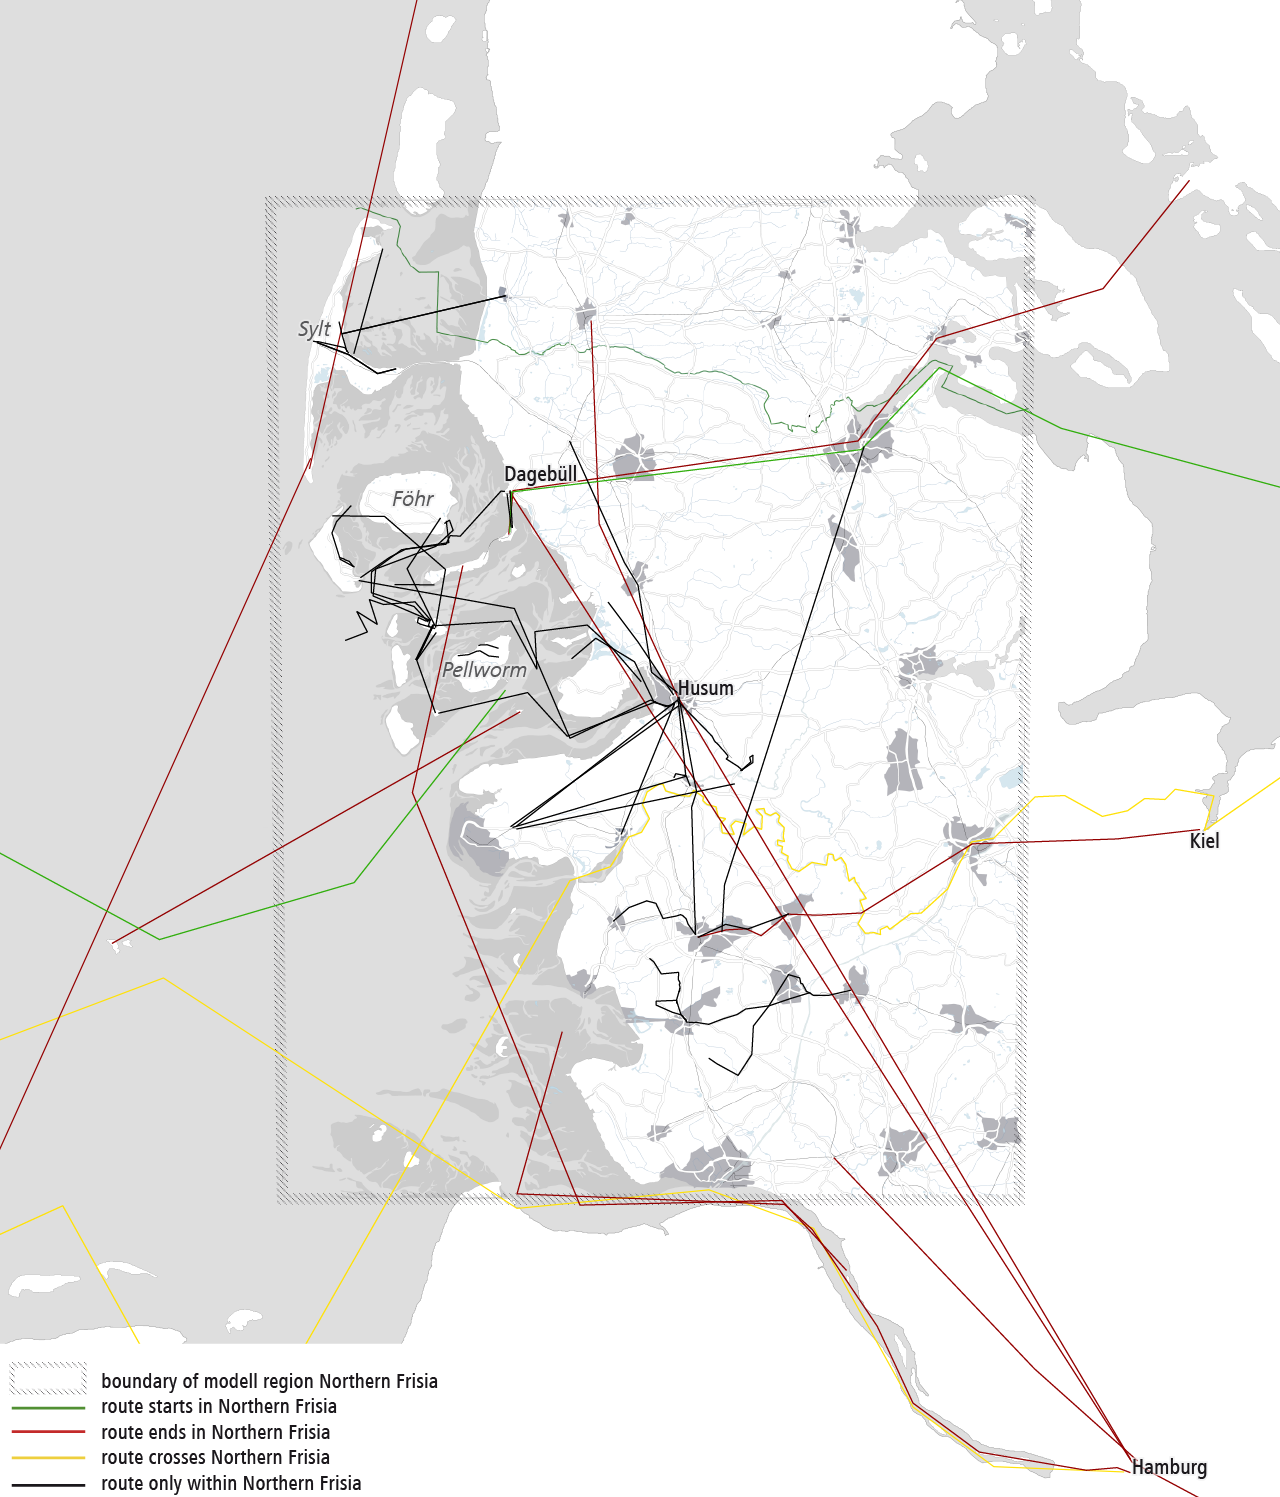
Figure 6: GIS analysis of characters' routes through the fictional space (model region Northern Frisia). Body of texts: 113 fictional texts (novels, novellas, short stories etc.), published in their majority between 1847 and 1938. Surprisingly and despite the fact that Northern Frisia is a coastal region there is almost no moving activity within the fictional space (this becomes even more evident when compared to figure 7 below).

Figure 7: GIS analysis of characters' routes through the fictional space (model region Prague). Body of texts: 77 fictional texts (novels, novellas, short stories etc.), published in their majority between 1861 and 1918. Prague appears clearly as a nod, a network of trajectories, a firework of movements – a high density of movements can be detected in the center of Prague (black lines).
